Education and Child Care
Overview
Education data is essential to understanding how the youth and the education system of a community are fairing. This data covers kids from early childcare all the way through college enrollment. Exploring education data can help us highlight areas of not only success and growth, but also challenges the youth population faces. SDC includes education data from Michigan Center for Educational Performance and Information (CEPI), Great Start to Quality (GSQ), and American Community Survey (ACS) detailing early childhood childcare, academic performance 3rd grade through college enrollment, attendance, and many more.
Take Action!
Is this an issue you care about? Connect with one of the organizations below to find resources and support on this topic.
PEDALS
PEDALS, is a partnership between the Ralph C. Wilson, Jr. Foundation and the Community Foundation for Southeast Michigan, improves preschool children’s emotional competence and skill.
Hope Starts Here
The HSH framework is composed of six teams focused on promoting health, youth development and well-being, parent and family leadership, providing high quality programs and professions, creating safe and inspiring environments, better alignment of resources and systems, and increasing and aligning early childhood system funding.
Help Me Grow
Helps families find child development check-ups, parents support, quality early learning, basic needs, healthcare or behavior support, home visiting programs and much more!
All data sources are from the American Community Survey unless otherwise noted.
Indicators on the Profile Page |
Why It's Important |
|---|---|
Child Care (GSQ and IFF) |
|
|
|
School Enrollment |
|
|---|---|
|
|
Educational Attainment |
|
|---|---|
|
|
Assessments (CEPI) |
|
|---|---|
|
|
Free and Reduced School Lunch (CEPI) |
|
|---|---|
|
|
Student Mobility and Chronic Absenteeism (CEPI) |
|
|---|---|
|
|
Graduation Rate (CEPI) |
|
|---|---|
|
|
College Enrollment and Readiness (CEPI) |
|
|---|---|
|
|
Methodology
Early Childhood Education in Detroit – IFF
Access to Early Childhood Education (ECE) services throughout Detroit is vital to ensure equitable educational opportunities to all communities. This access is measured by the ECE seat gaps based on the population of children ages 0-5 and the number of seats available at different ECE facilities across the city of Detroit. ECE Services are important factors in child development, academic success, economic growth, and becoming successful adults. IFF, a Community Development Financial Institution, completed an analysis of this information in 2024. Analyzing this information and providing the findings allows for identification of significant service gaps.
- Family income eligibility for subsidized child care
- GSRP: families living below 250% of the Federal Poverty Level (FPL)
- CDC state subsidy: families living below 200% of the FPL
- HS/EHS federal subsidy = families living below 100% of the FPL
- Supply: the number of licensed childcare seats in a specific geography (e.g. census tract/neighborhood/city).
- Demand: the number of children under age six in a specific geography.
- Service Level: The percentage of children under age six that can be served by the existing licensed capacity. It provides an estimate of the degree of service coverage in that area.
- Service Level Gap: Difference between the supply and the demand. It provides an estimate of the scale of the unmet need for childcare in that area.
- Quality providers are defined as those maintaining one of the three higher Quality Levels: Enhancing Quality, Enhancing Quality-Validated, and Demonstrating Quality.
ECE Gap Analysis Methodology:
- Demand for ECE seats is estimated from the 2022 Esri single-year data on the population of infants and toddlers (ages 0-2 years), preschoolers (ages 3-5 years), and Pre-K (67% of 4-year-olds and 33% of 5-year-olds). This data was further combined with poverty data from American Community Survey 2017-2021 to identify populations eligible for state and federal subsidies.
- Supply of ECE seats is calculated from the June 2023 data on provider capacity from the Michigan Department of Education’s (MDE) Office of Great Start (OGS). Data is combined from the Child Development and Care (CDC) Program, the MDE OGS Great Start Readiness Program (GSRP), the MDE OGS Head Start Collaboration (Head Start/Early Head Start), the Michigan Department of Licensing and Regulatory Affairs (LARA), and the Early Childhood Investment Corporation’s (ECIC) Great Start to Quality (GSQ).
- Discrepancies in Head Start/Early Head Start data in Detroit were resolved by contacting the six grantees in the City of Detroit to get the revised HS/EHS seat numbers.
- The service gaps in ECE seats are calculated by subtracting the demand from the supply for different geographies such as the City of Detroit, council districts, neighborhoods, and census tracts.
Great Start to Quality
Great Start to Quality (GSQ) measures the quality of early childhood programs and providers in Michigan by using more than 40 program quality indicators aligned with Michigan's Early Childhood Standards of Quality for Infant and Toddler Programs and Early Childhood Standards of Quality for Prekindergarten. The program quality indicators are standards used to measure the quality of a program in a specific area. Licensed programs and providers participate in the quality evaluations on a voluntary basis. Each program quality indicator falls into one of five categories.
The five categories used to measure quality include:
- Staff Qualifications and Professional Development: The training and any education or degrees completed by providers and their staff.
- Family and Community Partnerships: How programs offer support, and interact with, the families they serve and within the community.
- Administration and Management: How a program’s policies guide the way they run their program.
- Environment: The safety of a program and how they support the health and wellness of the children.
- Curriculum and Instruction: The tools a program uses to teach, accommodate needs and track development of the children in their care.
These categories, and their corresponding program quality indicators, are how programs and providers are rated when they complete their Self-Assessment Survey. Each program receives one of the quality level ratings: maintaining health and safety, reflecting on quality, enhancing quality, enhancing quality-validated, and demonstrating quality.
All licensed programs and providers in Michigan have a program profile on Great Start to Quality, where they are automatically assigned a maintaining health and safety quality level. If they choose to participate in the Great Start to Quality rating process, their quality level rating will be based upon their self-assessment and evaluation.
Early childhood programs include:
- Child Care and Preschool Centers: Child Care and Preschool Centers: A licensed center-based setting usually with multiple classrooms, including child care, preschool, Early Head Start, Head Start and Great Start Readiness Programs.
- Family Child Care Homes: A registered home-based setting for up to 6 children.
- Group Child Care Homes: A licensed home-based setting for up to 12 children.
ECE Data
Early Childhood Education and care data in the State of the Detroit Child are split across three tables, descriptions of which follow.
Columns |
Description |
|---|---|
Child Care: D3-Child-Care-Centers table |
|
| Centers | Number of licensed child care facilities. |
| GrpHmeCnt | Number of group homes. |
| FamHmeCnt | Number of family homes. |
| LicCenCnt | Number of licensed child care centers. |
The table D3-Child-Care-Programs houses data on the following columns: |
|
|---|---|
| LicCenCnt | Number of licensed child care centers. |
| EarlyHSCnt | Number of early Head Start programs. |
| GSRPCnt | Number of GSRP programs. |
| HSCnt | Number of Head Start programs. |
The table D3-Child-Care-Capacity houses data on the following columns: |
|
|---|---|
| Capacity | Total capacity of licensed child care facilities. |
| CapEarlyHS | Capacity of early head start programs. |
| CapGSRP | Capacity of GSRP programs. |
| CapHS | Capacity of Head Start programs. |
American Community Survey Data
The ACS collects data both about people currently enrolled in school, as well as the highest level attained by those no longer enrolled.
Sample Survey Questions on this Topic
School Enrollment
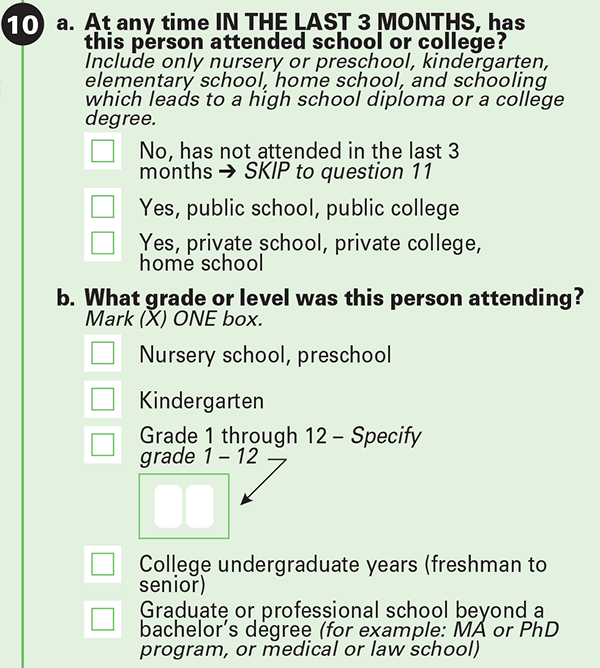
A person is counted as enrolled in school if they currently attend a public school, private school, college or university. This count excludes vocational, technical or business schools such as trade schools or on the job training.
The ACS displays school enrollment by itself, in conjunction with the type of school, (public or private) or by the grade level. Table B14007 contains preschool, kindergarten and all 12 grades, but for most tables, enrollment is simply provided as “enrolled/not enrolled” or in the categories below:
- Enrolled in school:
- Enrolled in nursery school, preschool
- Enrolled in kindergarten
- Enrolled in grade 1 to grade 4
- Enrolled in grade 5 to grade 8
- Enrolled in grade 9 to grade 12
- Enrolled in college, undergraduate years
- Graduate or professional school
- Not enrolled in school
From the Census: Why We Ask: School Enrollment
Code |
Title |
|---|---|
School Enrollment |
|
| B14001 | School Enrollment by Level of School |
| B14002‡ | Sex by School Enrollment by Level of School by Type of School |
| B14003‡ | Sex by School Enrollment by Type of School by Age |
| B14004 | Sex by College or Graduate School Enrollment by Type of School by Age |
| B14005‡ | Sex by School Enrollment by Educational Attainment by Employment Status for the Population 16 to 19 Years |
| B14006 | Poverty Status by School Enrollment by Level of School |
| B14007‡† | School Enrollment by Detailed Level of School |
| B26105 | Group Quarters Type (3 Types) by School Enrollment |
| B26205 | Group Quarters Type (5 Types) by School Enrollment |
| ‡Table also available in "collapsed" version: change "B" to "C" for table code. | |
| †Also available in racial iterations. | |
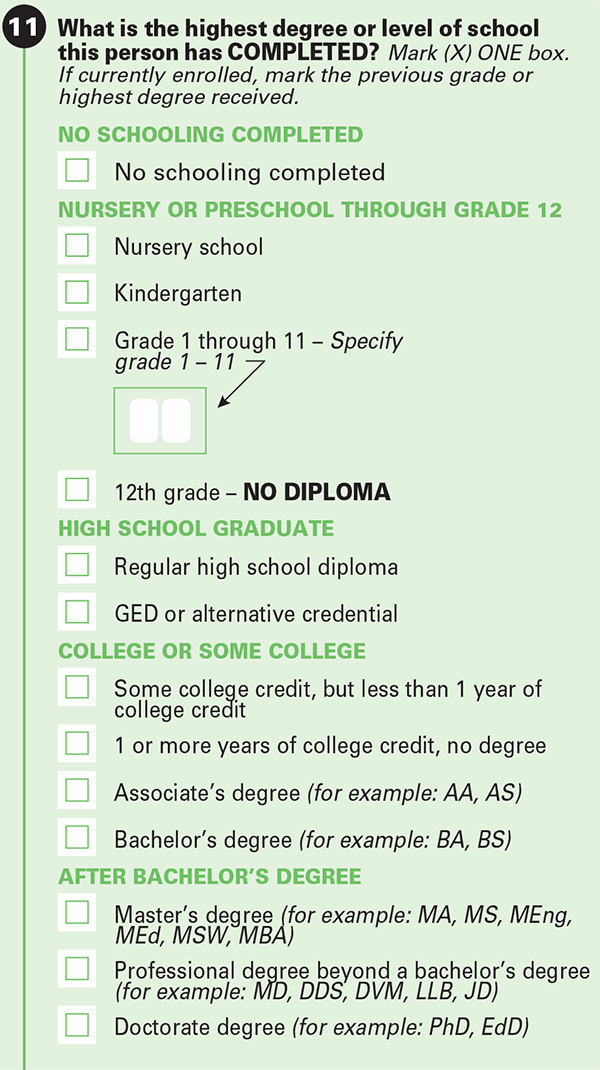
Educational Attainment
In general, data about educational attainment is about people 25 years and older, although you should check the table universe to be sure. Table B15003, Educational Attainment, contains very detailed counts of the educational attainment of persons 25 years or older, down to each primary and secondary school grade level, as well as GED, partial college, and Associate's, Bachelor's, Master's, Professional and Doctorate degrees. Table B15002: Sex by Educational Attainment is nearly as detailed. Educational Attainment can be found in tables beginning with 15.
From the Census: Why We Ask: Educational Attainment, Undergraduate Field of Degree
Code |
Title |
|---|---|
Educational Attainment |
|
| B15001 | Sex by Age by Educational Attainment |
| B15002‡† | Sex by Educational Attainment |
| B15003‡ | Educational Attainment |
| ‡Table also available in "collapsed" version: change "B" to "C" for table code. | |
| †Also available in racial iterations. | |
Tables relating educational attainment to other subjects mostly use only four or five categories:
- Less than high school graduate
- High school graduate (includes equivalency)
- Some college or associate's degree
- Bachelor's degree or higher
- Graduate or professional degree (left out when only four categories are used)
Code |
Title |
|---|---|
Educational Attainment |
|
| B06009§ | Place of Birth by Educational Attainment in the United States |
| B07009§ | Geographical Mobility in the Past Year by Educational Attainment for Current Residence in the United States |
| B07409§ | Geographical Mobility in the Past Year by Educational Attainment for Residence 1 Year Ago in the United States |
| B13014 | Women Who Had a Birth by Marital Status and Educational Attainment |
| B14005‡ | Sex by School Enrollment by Educational Attainment by Employment Status for the Population 16 to 19 Years |
| B16010‡ | Educational Attainment and Employment Status by Language Spoken at Home |
| B17003‡ | Poverty Status of Individuals by Sex by Educational Attainment |
| B17018‡ | Poverty Status of Families by Household Type by Educational Attainment of Householder |
| B20004 | Median Earnings by Sex by Educational Attainment |
| B21003 | Veteran Status by Educational Attainment for the Civilian Population 25 Years and Over |
| B23006 | Educational Attainment by Employment Status for the Population 25 to 64 Years |
| B25013 | Tenure by Educational Attainment of Householder |
| B26106 | Group Quarters Type (3 Types) by Educational Attainment |
| B26206 | Group Quarters Type (5 Types) by Educational Attainment |
| B27019 | Health Insurance Coverage Status and Type by Age by Educational Attainment |
| B28006 | Educational Attainment by Presence of a Computer and Types of Internet Subscription in Household |
| B29002 | Citizen, Voting-age Population by Educational Attainment |
| ‡Table also available in "collapsed" version: change "B" to "C" for table code. | |
| §Tabulated for Puerto Rico. Add 'PR' to the table code. Column names may vary slightly from non-PR version. | |
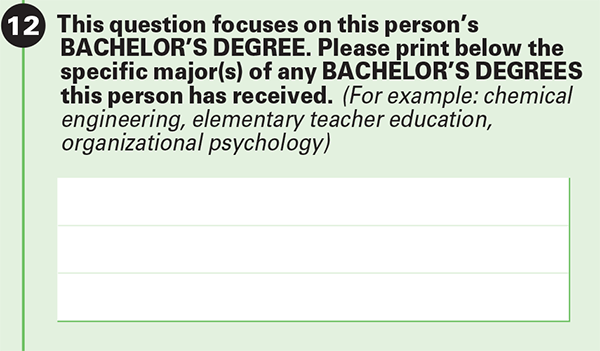
Field of Degree
Respondents who received a Bachelor's Degree or higher were asked to provide the subject of their original Bachelor’s degree. Three tables present this data in various forms.
Table B15011, Sex by Age by Field of Degree, groups the responses into:
- Science and Engineering
- Science and Engineering Related Fields
- Business
- Education
- Arts, Humanities and Other
The other two tables, B15010, Detailed Field of Bachelor’s Degree, and B15012, Total Fields of Bachelor's Degrees Reported, both use a more detailed set of categories, exactly the same in both tables. Note: to preserve individual privacy, table B15010 is only included in the 1-year ACS, and so, only contains data for areas of 65,000 or more.
Code |
Title |
|---|---|
Field of Degree |
|
| B15010‡† | Detailed Field of Bachelor's Degree for First Major |
| B15011 | Sex by Age by Field of Bachelor's Degree for First Major |
| B15012‡ | Total Fields of Bachelor's Degrees Reported |
| ‡Table also available in "collapsed" version: change "B" to "C" for table code. | |
| †Also available in racial iterations. | |
Michigan Center for Educational Performance and Information Data
The Michigan Center for Educational Performance and Information (CEPI) coordinates the collection of education data for the State of Michigan. The data is provided through a portal called MI School Data. This data includes M-STEP test data, graduation, and drop out statistics. Through this data we report information related to both English Language Arts (ELA) and Math M-STEP testing that takes place during 3rd grade and 8th grade, as well as graduation rates. Data from CEPI is published for both traditional public schools and charter schools. The numbers that we report on the State of the Child from the tables below include both public and charter schools combined. If there are fewer than 10 observations, the information is suppressed for privacy reasons.
For data aggregations in this tool we use the Michigan Center for Educational Performance and Information (CEPI) Educational Entity Master File to filter on open and active schools with an address that we can geocode (or match to a location). MI School Data files contain suppressed data and because of this schools with less than 10 students assessed or reported for each file are removed. We then impute any remaining suppressed values by assigning it to the midpoint of the range provided (e.g. if a school reports 100 students assessed and the number met is suppressed as >= 90% then we impute the value, assigning 95 students as the number met).
Columns |
Description |
|---|---|
Michigan Third Grade English Language Arts Proficiency: D3-ELA-Proficiency table |
|
| ELANumAssessed_Calc | Total students taking ELA Assessment |
| ELATotalMet_Calc | Number of students who met or exceeded expectations in ELA |
| ELATotalNotMet_Calc | Number of students who did not meet expectations in ELA |
Michigan Eighth Grade Math Proficiency: D3-Eighth-Grade-Math-Assessment table |
|
|---|---|
| numberasse | Total students taking Math Assessment |
| totalmet | Number of students who met or exceeded grade level standards in Math |
Michigan High School Graduation Rate Table: D3-Graduation-Rates table |
|
|---|---|
| CohortCount | Total number of students with the potential to graduate in the current shcool year |
| GradCnt | Number of graduates in the current school year |
| GradRate | Percentage of potential graduates to graduate in the current year |
Michigan Student Mobility: D3-Student-Mobility table |
|
|---|---|
| s_count | Number of public school students. |
| s_mobile | Number of public school students either leaving or entering a new school during the school year. |
Michigan Chronic Absenteeism: D3-Chronic-Absenteeism table |
|
|---|---|
| n_total | Number of public school students. |
| n_chronabs | Number of public school students missing 10% or more school days. |
Michigan College Enrollment: D3-College-Enrollment table |
|
|---|---|
| TotGrad | Number of public high school graduates who received a diploma during the high school graduation year. |
| TotEnrl | Number of public high school graduates who have enrolled in college within 12 months of graduation. |