Health and Health Insurance
Overview
There are many datasets reporting on the health of residents in all communities. Exploring these datasets can help to identify opportunities and challenges for communities, governments, organizations and residents whose work may focus on the health of the local residents. Health data covers a vast array of areas including death, immunizations, elevated blood lead levels, hospital visits through Medicaid and several datasets focused on health insurance. These topics can be explored individually or combined to help understand the full picture of the health of residents in a community.
Take Action!
Is this an issue you care about? Connect with one of the organizations below to find resources and support on this topic.

Get the Lead Out Detroit Coalition
The Get the Lead Out Detroit Coalition (Coalition) was established with the support of the Fred A. and Barbara M. Erb Family Foundation with a purpose of reducing the number of Detroit children poisoned by lead hazards in the home and in soil by identifying and executing strategies to support lead safe kids and lead safe homes for families.
Hope Starts Here
The HSH framework is composed of six teams focused on promoting health, youth development and well-being, parent and family leadership, providing high quality programs and professions, creating safe and inspiring environments, better alignment of resources and systems, and increasing and aligning early childhood system funding.
Help Me Grow
Help Me Grow helps families find child development check-ups, parents support, quality early learning, basic needs, healthcare or behavior support, home visiting programs and much more!
All data sources are from the American Community Survey unless otherwise noted.
Indicators on the Profile Page |
Why It's Important |
|---|---|
Infant Mortality (MDHHS) |
|
|
|
Immunizations (MDHHS) |
|
|---|---|
|
|
Elevated Blood Lead Levels (EBLL) (MDHHS) |
|
|---|---|
|
|
Emergency room and urgent care use (MDHHS) |
|
|---|---|
|
|
Health insurance |
|
|---|---|
|
|
Methodology
American Community Survey Data
The American Community Survey added questions about health insurance in 2008. Edits were made to the health care questions in 2009 that make direct comparison with the first year responses impossible without adjustments. In 2012, tables were added to count health insurance coverage for people aged 19 to 25.
The simplest source for data about coverage is table C27001. This table divides males and females into three age brackets: children (under 18), senior citizens (65 and older), and adults (18-64). For each combination of sex and age, there are simply two columns: covered, or not covered. The B27001 table provides finer grained detail, with nine age brackets. These tables are also provided in the nine standard racial iterations.
Tables B27002/C27002 through B27009/C27009 are structured indentically, but only count specific types of coverage. There are no racial iterations for these tables.
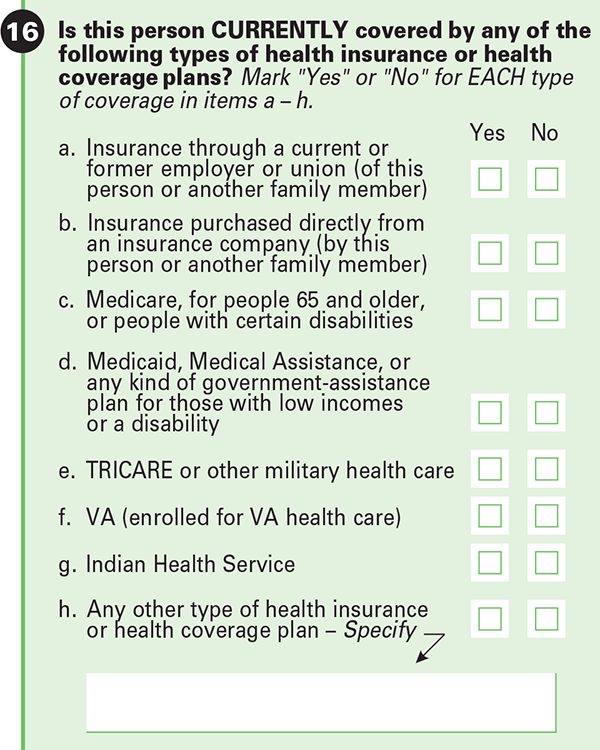
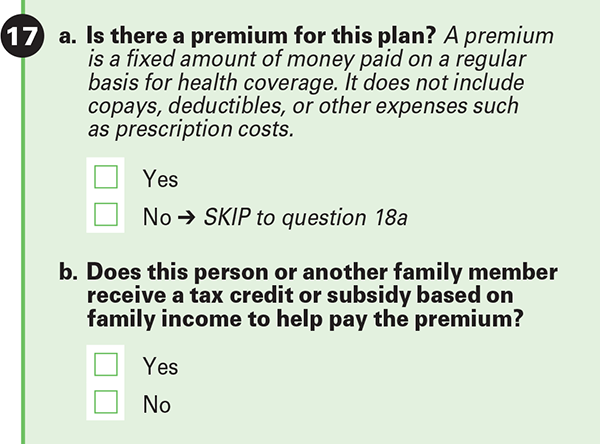
From the Census: Why We Ask: Health Insurance Coverage
Sample Survey Questions on this Topic
Code |
Title |
|---|---|
Health Insurance |
|
| B27001†‡ | Health Insurance Coverage Status by Sex by Age |
| B27002‡ | Private Health Insurance Status by Sex by Age |
| B27003‡ | Public Health Insurance Status by Sex by Age |
| B27004‡ | Employer-based Health Insurance by Sex by Age |
| B27005‡ | Direct-purchase Health Insurance by Sex by Age |
| B27006‡ | Medicare Coverage by Sex by Age |
| B27007‡ | Medicaid/Means-tested Public Coverage by Sex by Age |
| B27008‡ | Tricare/Military Health Coverage by Sex by Age |
| B27009‡ | VA Health Care by Sex by Age |
| B27010‡ | Types of Health Insurance Coverage by Age |
| B27011 | Health Insurance Coverage Status and Type by Employment Status by Age |
| B27012‡ | Health Insurance Coverage Status and Type by Work Experience by Sex by Age |
| B27013‡ | Private Health Insurance by Work Experience by Sex by Age |
| B27014‡ | Public Health Insurance by Work Experience by Sex by Age |
| B27015 | Health Insurance Coverage Status and Type by Household Income in the Past 12 Months (In 2012 Inflation-adjusted Dollars) |
| B27016‡ | Health Insurance Coverage Status and Type by Ratio of Income to Poverty Level in the Past 12 Months by Age |
| B27017‡ | Private Health Insurance by Ratio of Income to Poverty Level in the Past 12 Months by Age |
| B27018‡ | Public Health Insurance by Ratio of Income to Poverty Level in the Past 12 Months by Age |
| B27019 | Health Insurance Coverage Status and Type by Age by Educational Attainment |
| B27020 | Health Insurance Coverage Status and Type by Citizenship Status |
| B27021 | Health Insurance Coverage Status and Type by Living Arrangement |
| B27022 | Health Insurance Coverage Status by Sex by Enrollment Status for Young Adults Aged 19 to 25 |
| B27023 | Private Health Insurance by Sex by Enrollment Status for Young Adults Aged 19 to 25 |
|
‡Table also available in "collapsed" version: change "B" to "C" for table code. †Tables B27001, C27001 also available in racial iterations. |
|
Michigan Department of Health and Human Services Data
Deaths
The deaths dataset contains a row for each death in the State of Michigan. Each death record contains geographic information such as a Census Tract or latitude and longitude. When latitude and longitude were provided for a death, D3 tagged the record with the related census tract and then added all of the deaths in that tract together. Where this was not available the record was removed.
Profile pages include data on the number of infant deaths (defined as death before age one), unsafe sleep related infant deaths (ICD-10 code W75), and infant deaths due to assault or maltreatment (ICD-10 codes X85 - Y09) collected by the State of Michigan Office of Vital Statistics at the state, county, county subdivision, and congressional district levels in Michigan.
Columns |
Description |
|---|---|
Infant Mortality Data: D3-Infant-Mortality table |
|
| InfantMort | Total number of infant deaths |
| SafeSleep | Number of unsafe sleep related deaths |
| AssaultMal | Number of assault or maltreatment related deaths |
Elevated Blood Lead Levels
Data on tests for elevated blood lead level is collected by the Michigan Department of Health and Human Services at the individual level. For this analysis, D3 anonymized the data and aggregated it up to various geographies. Geographies with fewer than 6 individuals with elevated blood lead levels are suppressed (or removed) to protect anonymity. EBLLs are defined as a blood lead level 3.5 micrograms per deciliter or greater (the unit of measure used to determine lead levels which is micrograms of lead per deciliter of blood).
The table D3-Blood-Lead houses data on the following columns:
Columns |
Description |
|---|---|
Blood Lead Levels Data: D3-Blood-Lead table |
|
| CntTested | Number of individuals who were tested |
| EBLL | Number of individuals tested with an elevated blood lead level, defined as ≥ 3.5 micrograms per deciliter |
| Under6CntTested | Number of individuals, under 6 years of age, who were tested |
| Under6EBLL | Number of individuals tested, under 6 years of age, with an elevated blood lead level, defined as ≥ 3.5 micrograms per deciliter |
| Under18CntTested | Number of individuals, under 18 years of age, who were tested |
| Under18EBLL | Number of individuals tested, under 18 years of age, with an elevated blood lead level, defined as ≥ 3.5 micrograms per deciliter |
Immunizations
Data on the number of fully or partially immunized people collected by the Michigan Care Improvement Agency at the county, county subdivision (in Wayne County), congressional district, State House district, State Senate district, and Census tract levels in Michigan. For this analysis, MDHHS determined immunization status using a National Immunization Survey (NIS) - like methodology, which is a count of both valid and invalid doses. This allows for comparisons with other states. Full immunization, denoted as "fully immunized," includes 4 DTaP, 3 Polio, 1 MMR, 3 Hib, 3 HepB, 1 Varicella, 4 PCV, and 2 HepA vaccinations. Partial immunization, minus HepA and minus PCV, lack HepA and/or PCV vaccinations, respectively.
D3 receives the immunizations dataset from MDHHS as a tract level dataset containing counts of people for each series of vaccinations. For aggregation in the tool we sum the number of kids in the census tract that were complete for series 431331, 4313314, and 43133142 respectively.
Columns |
Description |
|---|---|
Immunization Data: D3-Immunization table |
|
| Immunization_Population | Immunized children aged 19-35 months |
| Fully_Immunized_43133142 | Number fully immunized |
| Partially_Immunized_4313314 | Number partially immunized (minus HepA) |
| Partially_Immunized_431331 | Number partially immunized (minus HepA and PCV) |
Medicaid
The Michigan Department of Health and Human Services (MDHHS) collects data on patients under 18 years of age who visited the hospital through Medicaid. This dataset includes information about the number of these visits that were to the emergency room, as well as the number of visits that were related to asthma or diabetes. If there were fewer than 6 observations, the information is suppressed (or removed) for privacy reasons.
D3 received the Medicaid dataset as a tract level dataset containing a count of visits per census tract.
For aggregation in the tool: we summed the count of visits for each category: total hospital visits or emergency room visits, for condition (asthma or diabetes), and age group (4 and under or between 5 and 17).
Columns |
Description |
|---|---|
Medicaid Data: D3-Medicaid table |
|
| Under18_Tot | Total number of hospital or ER visits through Medicaid for children (under 18) |
| FivePlus_Tot | Total number of hospital or ER visits through Medicaid for children over 5 |
| Under5_Tot | Total number of hospital or ER visits through Medicaid for children under 5 |
| AsthmaCt | Total number of hospital or ER visits for children through Medicaid related to Asthma |
| Diabetes1Ct | Total number of hospital or ER visits for children through Medicaid related to Type 1 Diabetes |
| Diabetes2Ct | Total number of hospital or ER visits for children through Medicaid related to Type 2 Diabetes |
| DiabetesOtherCt | Total number of hospital or ER visits for children through Medicaid related to other types of Diabetes (excluding Type 1 and 2) |
| Tot_Hosp_Visits | Total number of hospital visits through Medicaid for children under 18 |
| Under5_Hosp | Total number of hospital visits through Medicaid for children under 5 |
| Tot_ER_Visits | Total number of ER visits through Medicaid for children (under 18) |
| FivePlus_ER | Total number of ER visits through Medicaid for children over 5 |
| Under5_ER | Total number of ER visits through Medicaid for children under 5 |
| PctOvr5ER | Percent of total children over 5 who visited the ER through Medicaid |
| PctUndr5ER | Percent of total children under 5 who visited the ER through Medicaid |
| PctAsthma | Percent of total children (under 18) who visited the ER through Medicaid related to Asthma |
| PctDiabetes | Percent of total children (under 18) who visited the ER through Medicaid related to Diabetes |
The Census provides additional insight into why this data is collected, in their “Why We Ask Questions About” pages.